

RANDOM CARD DISTRIBUTION IN POKER
Every hand of Texas Hold’em begins with the random distribution of cards from a standard 52-card deck. At a nine-handed table, 18 cards are dealt to players before the flop, leaving 34 cards in the deck. Although the specific cards dealt are unpredictable, their distribution follows precise mathematical probabilities.
How many aces, kings, or cards of a particular suit should we expect among those 18 cards? How frequently are the 1,326 possible starting-hand combinations dealt? And how do those expectations compare with the actual distribution of cards over hundreds or thousands of hands?

Random Card Distribution in Poker examines these questions through mathematical probabilities, expected frequencies, and numerical examples. We’ll begin with the distribution of individual ranks and suits, progress to starting-hand combinations and their frequencies over time, and then examine the distribution of unseen cards and its relationship to drawing probabilities.
The objective is to establish the mathematics of random card distribution, distinguishing what can be calculated precisely from the variation that occurs in individual deals and playing sessions.
RANDOM DISTRIBUTION OF A 52-CARD DECK
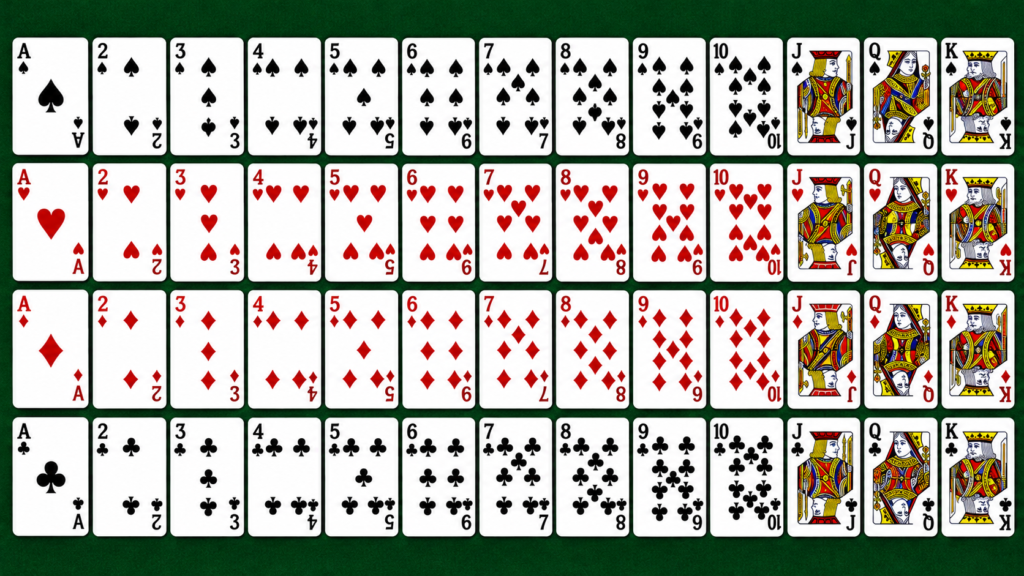
A standard deck contains 52 cards, consisting of 13 ranks and four suits. Each rank appears four times, once in each suit, while each suit contains 13 cards.
In a nine-handed Texas Hold’em game, each player receives two hole cards. That means 18 cards are dealt to the table, leaving 34 cards undealt. Those 18 cards represent 34.62% of the deck, or nearly 35%.
Random Card Distribution allows us to calculate the expected number of cards of any given rank or suit among those 18 cards.
DISTRIBUTION BY RANK
Since each rank appears four times in the deck, the expected number of cards from any particular rank among the 18 cards dealt to nine players is:
4 × (18 ÷ 52) = 1.3846 cards
This means that, over a large number of randomly shuffled deals, an average of approximately 1.385 cards of each rank will be distributed among the nine players per deal.
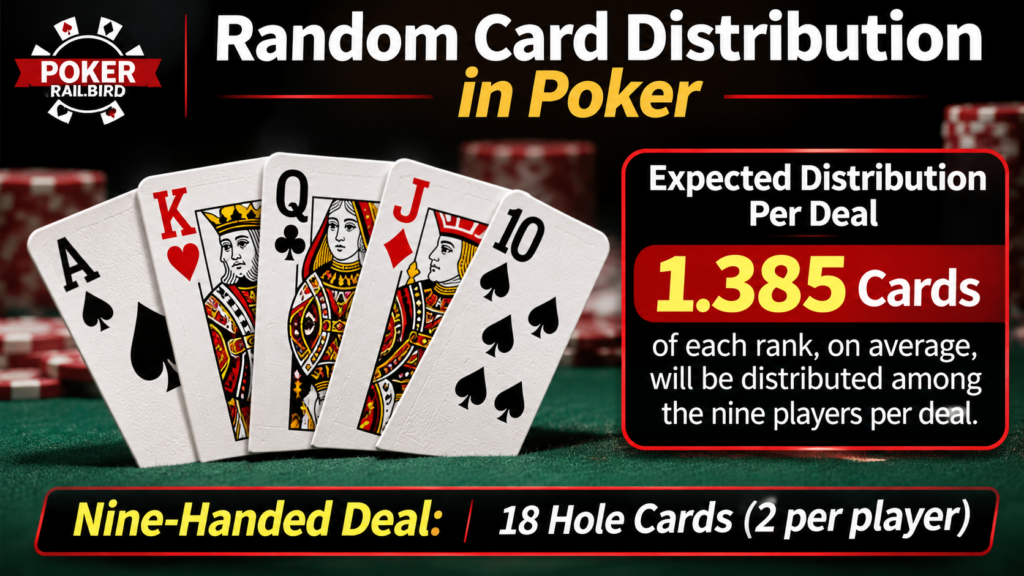
For example, across 1,000 nine-handed deals, we would expect approximately 1,385 aces to be distributed collectively among the players. The same expectation applies to kings, queens, jacks, and every other rank.
In an individual deal, however, anywhere from zero to all four cards of a particular rank may be distributed.
PROBABILITY DISTRIBUTION OF A PARTICULAR RANK
| Aces Dealt | Probability |
|---|---|
| 0 |
17.13% |
| 1 |
39.79% |
| 2 |
31.70% |
| 3 |
10.25% |
| 4 |
1.13% |
| Total | 100.00% |
Although the expected distribution is approximately 1.385, the actual number of cards from a particular rank varies from deal to deal.
Using aces as an example, the probability that zero, one, two, three, or all four aces are among the 18 dealt cards is displayed on the chart to the left.
The same probability distribution applies to every other rank.
DISTRIBUTION BY SUIT
Each suit contains 13 cards. Therefore, the expected number of cards from any one suit among the 18 dealt cards is:
13 × (18 ÷ 52) = 4.5 cards
This applies equally to spades, hearts, diamonds, and clubs.
PROBABILITY DISTRIBUTION OF A PARTICULAR SUIT
As with individual ranks, the actual distribution of suits varies between deals.
Using hearts as an example, the probability of different quantities appearing among the 18 dealt cards is reflected in the chart to the right.
The same probability distribution applies to spades, diamonds, and clubs.
These calculations establish the expected distribution of individual ranks and suits. We can now examine how those 52 cards produce the 1,326 possible starting-hand combinations.
| Hearts Dealt | Probability |
|---|---|
| 0–2 |
8.59% |
| 3 |
16.85% |
| 4 |
25.28% |
| 5 |
24.50% |
| 6 |
15.73% |
| 7 or more |
9.06% |
| Total | ≈100% |
THE 1,326 STARTING HAND COMBINATIONS
In Texas Hold’em, each player receives two cards from a standard 52-card deck. The number of possible two-card combinations is calculated as follows:
(52 × 51) ÷ 2 = 1,326 combinations
Each of these 1,326 combinations has an equal probability of being dealt to any particular player.
1 ÷ 1,326 = 0.0754%
However, poker starting hands are also classified by rank and whether the cards are paired, suited, or off-suit. When grouped this way, the 1,326 combinations produce 169 distinct starting-hand classes.
DISTRIBUTION OF STARTING-HAND COMBINATIONS
The 169 starting-hand classes consist of 13 pocket pairs, 78 suited classes, and 78 offsuit classes.
Each class contains a different number of specific two-card combinations.
| Starting-Hand Type | Hand Classes | Combinations per Class | Total Combinations |
|---|---|---|---|
| Pocket Pairs | 13 | 6 | 78 |
| Suited Hands | 78 | 4 | 312 |
| Offsuit Hands | 78 | 12 | 936 |
| Total | 169 | — | 1,326 |
These combinations produce the following probabilities for any randomly dealt starting hand:
| Starting-Hand Type | Probability |
|---|---|
| Pocket Pairs |
5.88% |
| Suited Hands |
23.53% |
| Offsuit Hands |
70.59% |
| Total | 100.00% |
PROBABILITY OF SPECIFIC STARTING HANDS
Although every exact two-card combination has the same probability, starting-hand classes contain different numbers of combinations.
Consider three examples: pocket aces (AA), ace-king suited (AKs), and ace-king off-suit (AKo).
| Starting Hand | Combinations | Probability | Expected Frequency |
|---|---|---|---|
| AA Or any particular pocket pair | 6 | 0.4525% | 1 in 221 |
| AKs Or any particular suited hand class | 4 | 0.3017% | 1 in 331.5 |
| AKo Or any particular offsuit hand class | 12 | 0.9050% | 1 in 110.5 |
These frequencies represent long-run mathematical expectations for an individual player.
For example, pocket aces have six possible combinations, giving them a probability of 6 ÷ 1,326, or approximately 0.4525% on any independently shuffled deal.
That probability remains constant regardless of how frequently pocket aces appeared in previous hands. The number of actual occurrences during any particular playing session may differ from the expected frequency.
FROM STARTING HANDS TO PLAYING TIME

These calculations establish the mathematical frequency of each starting-hand combination for an individual player.
At a nine-handed table, however, nine starting hands are distributed during every deal. Over time, the total number of combinations dealt across the entire table increases substantially.
In Section 3, we’ll examine those frequencies over one hour, an eight-hour session, and extended playing periods, using an average of 25 hands per hour.
RANDOM CARD DISTRIBUTION OVER TIME
Random Card Distribution allows us to calculate the expected frequency of any starting-hand combination over a specified number of deals, whether examining one player or all nine players collectively.
For this analysis, we’ll use a nine-handed Texas Hold’em game dealing an average of 25 hands per hour, with all nine seats occupied.
HOW MANY STARTING HANDS ARE DISTRIBUTED OVER TIME?
Each player receives one starting hand per deal. With nine players at the table, every completed deal distributes nine starting hands.
Over a six-hour session, approximately 1,350 starting hands are distributed among the nine players. Since there are 1,326 possible two-card combinations, this represents approximately one expected occurrence of each specific combination, averaged over many such sessions.
| Playing Time | Hands per Player | Total Hands Dealt to 9 Players |
|---|---|---|
| 1 hour | 25 | 225 |
| 2 hours | 50 | 450 |
| 4 hours | 100 | 900 |
| 6 hours | 150 | 1,350 |
| 8 hours | 200 | 1,800 |
| 53 hours | 1,325 | 11,925 |
EXPECTED FRQUENCY OF INDIVIDUAL STARTING-HAND COMBINATIONS
| Playing Time | Expected Occurrences |
|---|---|
| 1 hour | 0.170 |
| 2 hours | 0.339 |
| 4 hours | 0.679 |
| 6 hours | 1.018 |
| 8 hours | 1.357 |
| 53 hours | 8.993 |
Imagine you’re playing at a full nine-handed table, and we’re tracking one particular starting hand: A♠K♠.
At 25 hands per hour, the dealer distributes 225 starting hands among the nine players every hour. During a six-hour session, that’s 1,350 starting hands.
There are 1,326 possible two-card combinations, and each has the same chance of being dealt. Across those 1,350 starting hands, we would therefore expect A♠K♠ to be dealt approximately once, on average.
That doesn’t guarantee someone will receive A♠K♠ during your six-hour session. It could appear twice or not at all. The average becomes meaningful over many sessions.
Remember, we’re counting all nine players. You personally receive only 150 starting hands during those six hours, and most of the hands distributed to your opponents will never be shown.
The chart illustrates how frequently one exact two-card combination can be expected to appear somewhere at the table as more hands are dealt.
EXPECTED FREQUENCY OF ANY SPECIFIC POCKET PAIR
Every pocket pair, from AA down to 22, has six possible two-card combinations within a standard 52-card deck. Consequently, the probability of being dealt any one particular pocket pair is identical: approximately 0.4525%, or once every 221 hands on average.
Consider an eight-hour poker session in which the dealer averages 25 hands per hour. During that session, you would receive approximately 200 starting hands.
Based on the 1-in-221 probability, you might expect to receive pocket aces about once during those 200 hands. However, that figure is a long-run average, and the actual results of any individual session can vary considerably.
| Times Dealt | Probability |
|---|---|
| Zero times |
40.37% |
| Exactly once |
36.70% |
| Twice or more |
22.93% |
| Total | 100.00% |
LONG TERM PROBABILITIES
For example, the probabilities of being dealt pocket aces during those 200 hands are:
- Zero times: 40.37%
- Exactly once: 36.70%
- Twice or more: 22.93%
The same probabilities apply to any other specific pocket pair, whether KK, QQ, JJ, or 22.
Consider what these numbers tell us. Even after playing eight hours and receiving 200 starting hands, there is approximately a 40% probability that you will not be dealt pocket aces even once. Conversely, there is nearly a 23% probability that you will receive them at least twice.

Over approximately 53 hours of play at 25 hands per hour, you would receive 1,325 starting hands. The long-run average for any particular pocket pair across that many hands is approximately six occurrences.
These calculations illustrate an important characteristic of random card distribution: the mathematical average describes what we should expect over many hands, but it does not determine what will happen during any particular session.
Receiving pocket aces three times in one evening, or going several sessions without seeing them, is entirely consistent with random card distribution.
EXPECTED DISTRIBUTION FOR AN INDIVIDUAL PLAYER
Consider a player who plays 53 hours at an average of 25 hands per hour.
53 × 25 = 1,325 starting hands
Since there are 1,326 possible combinations, this represents approximately one expected occurrence of each exact two-card combination, averaged over many such playing periods.
However, starting-hand classes contain different numbers of combinations.
These figures are mathematical expectations. For example, over 53 hours, a player would be expected to receive pocket aces approximately six times, although the actual number may differ substantially.
Expected occurrences rounded to the nearest whole number
| Starting Hand or Category | Expected Occurrences |
|---|---|
| One exact two-card combination Example: A♠K♠ | 1 |
| Pocket Aces (AA) Or any specific pocket pair | 6 |
| Ace-King Suited (AKs) Or any specific suited hand class | 4 |
| Ace-King Offsuit (AKo) Or any specific offsuit hand class | 12 |
| All Pocket Pairs | 78 |
| All Suited Hands | 312 |
| All Offsuit Hands | 935 |
The specific-hand examples in this table are included within their respective broader categories and should not be added to those category totals.
EXPECTED FREQUENCY VERSUS ACTUAL FREQUENCY
Suppose you play 1,325 hands of poker, approximately 53 hours at a table dealing 25 hands per hour.
Mathematically, you can expect to receive any particular pocket pair, such as AA, KK, QQ, or JJ, approximately six times over that many hands. That’s the expected frequency.
But when you look back at your actual results, you might discover that you received:
- AA: 3 times
- KK: 9 times
- QQ: 5 times
- JJ: 7 times
Those numbers represent your actual frequency: how often each hand was really dealt to you.
Each of those pocket pairs had the same probability of appearing. The difference in how often you received them is a normal result of random card distribution.

And here’s something important to understand: If you’ve played 300 hands without receiving pocket aces, your probability of being dealt Aces on the next hand is still 1 in 221. The deck has no memory of what happened previously.
Over many thousands of hands, the average frequency of each particular pocket pair tends to move closer to its mathematical probability. However, there’s no guarantee that any individual session, or even a series of sessions, will match the expected average.
Expected frequency tells us what the mathematics predicts on average. Actual frequency tells us what really happened.
RANDOM DISTRIBUTION OVER THE LONG TERM
As the number of independently shuffled deals increases, observed frequencies tend toward their theoretical probabilities. Individual sessions may produce substantially different results, but the underlying mathematical probabilities remain unchanged regardless of previous outcomes.
Having established the frequency of starting hands over time, we can now examine how randomly distributed cards affect the location of unseen cards and the probabilities associated with drawing them.
THE DISTRIBUTION OF UNSEEN CARDS AND OUTS
Random Card Distribution also determines the mathematical relationship between cards already dealt, cards whose locations are unknown, and the probability of drawing specific cards.
In a nine-handed Texas Hold’em game, 18 hole cards are distributed before the flop. Once the three flop cards are revealed, 21 of the original 52 cards have been dealt to players or placed face up on the board.
However, each player knows only their own two hole cards and the three community cards. The remaining 47 cards are unknown to that player, including the 16 hole cards held by eight opponents.
From your perspective, the 47 unknown cards consist of 16 cards in opponents’ hands and 31 cards in other locations. Those 31 cards include the 30 cards remaining in the deck and the single card burned before the flop.
The expected proportion of unknown cards held by opponents is:
16 ÷ 47 = 34.04%
The remaining proportion is:
31 ÷ 47 = 65.96%
| Card Location | Number of Cards |
|---|---|
| Your Two Hole Cards | 2 |
| Eight Opponents' Hole Cards | 16 |
| Three Community Cards | 3 |
| Cards Remaining in the Deck | 30 |
| Burned Card | 1 |
| Total | 52 |
These proportions apply equally to any particular rank, suit, or group of cards whose locations remain unknown.
THE DISTRIBUTION OF NINE FLUSH OUTS
| Card Location | Expected Flush Outs |
|---|---|
| Eight Opponents' Hole Cards | 3.064 |
| Other Unseen Cards | 5.936 |
| Total | 9.000 |
Consider a player holding four cards of the same suit after the flop, with nine cards of that suit remaining unseen.
Of those nine cards, some may be held by opponents, while others remain among the 31 unknown cards outside opponents’ hands.
We can calculate the expected distribution.
Expected outs in opponents’ hands:
9 × (16 ÷ 47) = 3.064 cards
Expected outs outside opponents’ hands:
9 × (31 ÷ 47) = 5.936 cards.
Thus, approximately 3.06 of the nine flush outs are expected to be in opponents’ hands, averaged across a large number of randomly distributed deals.
These are mathematical expectations. The actual number may range from zero to nine.
PROBABILITY DISTRIBUTION OF THE NINE FLUSH OUT
We can calculate the probability that a particular number of the nine unseen flush cards is held by the eight opponents.
| Flush Outs in Opponents' Hands | Probability |
|---|---|
| 0 |
1.48% |
| 1 |
9.26% |
| 2 |
23.16% |
| 3 |
30.26% |
| 4 |
22.69% |
| 5 |
10.09% |
| 6 |
2.64% |
| 7 |
0.39% |
| 8 |
0.0293% |
| 9 |
0.00084% |
| Total | ≈100% |
The most likely individual outcome is that opponents hold three of the nine cards, occurring about 30.26% of the time.
However, the actual distribution is unknown unless additional cards are revealed.
DISTRIBUTION OF DIFFERENT NUMBER OF OUTS
The same calculations apply to any specified number of unseen outs.
For example, we can compare nine flush outs, eight open-ended straight-draw outs, four gutshot outs, and two outs associated with improving a pocket pair to a set.
| Unseen Outs | Expected in Opponents' Hands | Expected Elsewhere |
|---|---|---|
| 9 | 3.0 | 6.0 |
| 8 | 2.5 | 5.5 |
| 4 | 1.5 | 2.5 |
| 2 | 0.5 | 1.5 |
The expected distribution is calculated using:
Expected outs in opponents’ hands = Number of unseen outs × (16 ÷ 47)
This formula describes the expected physical location of the unseen cards. It does not establish which specific cards are held by opponents in an individual deal.
WHAT DO THESE NUMBERS TELL US?
Random Card Distribution produces mathematically predictable results over time, even though the actual cards dealt during any individual hand or playing session remain uncertain.
In a nine-handed game, nearly 35% of the deck is distributed among the players before the flop. The expected distribution of cards by rank and suit can be calculated precisely, as can the frequency of each of the 1,326 possible starting-hand combinations.
The same mathematics applies to unseen cards. Although some potential outs may physically be held by opponents, their unknown locations are already accounted for in conventional drawing probabilities. When additional cards become known, those probabilities can be recalculated using the new information.
The underlying probabilities remain constant across independently shuffled deals. Actual results fluctuate, sometimes substantially, but their observed frequencies tend toward the mathematical expectations over the long term.

CONCLUSION
From the initial distribution of 18 hole cards among nine players to the appearance of community cards, every stage of Texas Hold’em follows established mathematical probabilities. Random Card Distribution in Poker provides a framework for understanding those probabilities and distinguishing long-term mathematical expectations from the variable outcomes of individual hands and playing sessions.