STARTING HAND FREQUENCY CHART IN POKER
UNDERSTANDING WHAT YOU ARE ACTUALLY DEALT
Most poker players think in terms of individual hands, strong hands, weak hands, and playable hands. But a starting hand frequency chart in poker shows something far more important: the actual distribution of hands you are dealt over time. Instead of focusing on isolated situations, this chart reveals the underlying structure of the game—how often premium hands occur, how frequently marginal hands appear, and why disciplined decision-making is mathematically necessary. If you want to improve your results in live cash games, you must understand not just what you hold, but how often those situations truly happen.
HOW TO USE THE STARTING HAND FREQUENCY CHART

Most players look at a chart like this and immediately ask, “What should I play?”
That’s the wrong question.
This starting hand frequency chart is not a set of instructions; it’s a structural reference. It shows you what exists, how often it appears, and why most decisions at the table are made with marginal hands, not premium ones.
Here’s how to use it correctly:
1. Understand the Distribution of Hands
Only a small percentage of hands are strong.
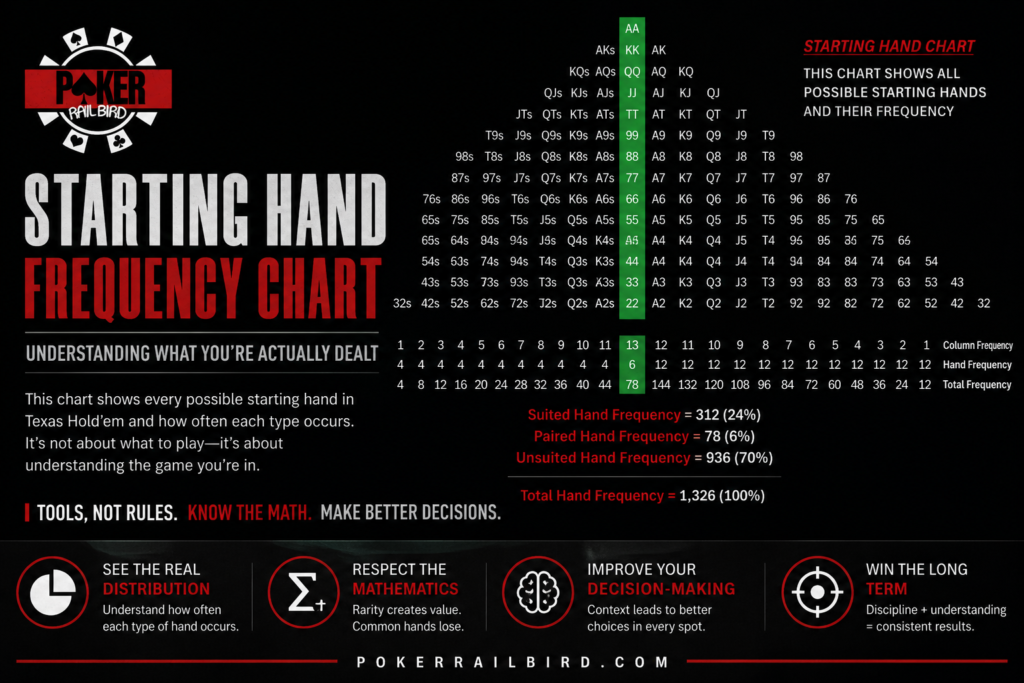
- Pocket pairs: 6%
- Suited hands: 24%
- Unsuited hands: 70%
Most of what you’re dealt is not premium, and that’s the foundation of poker.
2. Put Your Hand in Context
When you look down at your cards, don’t just ask “Is this good?”
Ask:
👉 How often does this actually occur?
This changes how you evaluate:
- hand strength
- risk
- and long-term expectation
3. Recognize Why Most Players Overplay Hands
Marginal hands appear constantly.
Players get tired of folding.
So they start playing hands that don’t hold up over time.
This chart shows exactly why that happens.
4. Connect This to Real Decisions
This is where it matters.
This chart helps explain:
- why tight ranges are mathematically correct
- why loose play increases variance and reduces edge
- why patience is not optional, it’s required