PREFLOP HAND EQUITY
BY NUMBER OF PLAYERS (2-10)
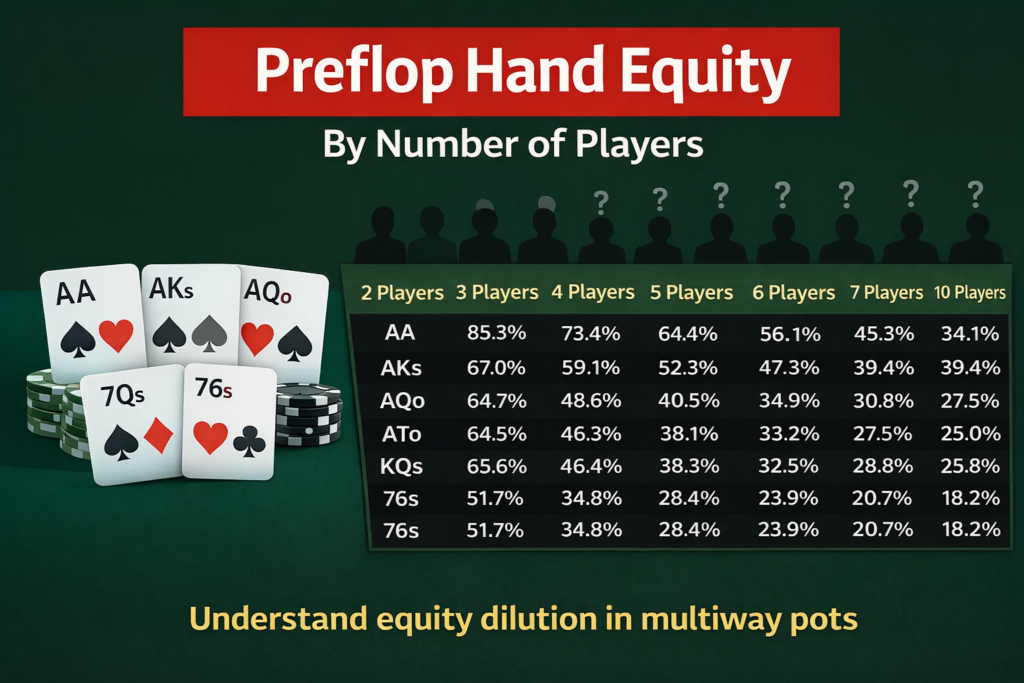
Preflop hand equity changes significantly as more players enter the pot, yet most players underestimate how quickly that equity declines in multiway situations. This chart shows how specific starting hands perform from heads-up play through ten players, making the math behind equity dilution visible. It is not a starting hand chart and it does not tell you what to play. It shows how the underlying structure of poker shifts as additional ranges enter the hand, which is critical for understanding loose games and multiway pots in live cash play.
WHY THIS MATTERS IN LIVE CASH GAMES
In loose poker games, four or more players routinely see the flop. Most players still think in heads-up terms. The math does not. As more players enter the pot, equity compresses and strong hands lose dominance faster than most players realize. This chart makes that structural shift visible.
HOW TO USE THIS HAND EQUITY CHART
This chart shows how the equity of specific starting hands changes as the number of players in the hand increases from two players to ten players.
Locate your starting hand in the left column. Then move across the row to see how its preflop equity shifts depending on how many opponents are in the pot.
For example, Ace-King offsuit has strong equity heads-up, but as more players enter the hand, its percentage decreases significantly. This is equity dilution in action. The more ranges involved, the less frequently any single hand will hold up.
This chart is not a starting hand chart. It does not tell you what to play.
It shows how the math changes when more players enter the pot.
Use it to understand:
(1) Why loose multiway pots require tighter hand selection.
(2) Why marginal hands lose value quickly in large fields.
(3) Why position and fold equity matter more than aggression alone.
In live cash games, most players underestimate how dramatically equity drops as more opponents see the flop. This chart makes that reality visible.